Louisville Homes Prices on the Rise in these Zip Codes (5-year Analysis)
By Nathan Garrett
Home buyers across the country have patiently waited in the wings for a more favorable housing market. Over the last few years, they have battled high home prices, low inventory, and drastic swings in interest rates - only to find little to no relief.
Since 2019, home prices here in Louisville have increased by 35.4%. However, some zip codes have experienced even more growth. This has offered a golden opportunity for sellers, but unfortunately, buyers have been left with a very challenging market, and the lack of affordability, has led many to either refine their search or even pause their home-buying plans.
In-Depth Analysis: Identifying High-Growth Areas
We have conducted a detailed analysis of 24,779 properties. Statistics gathered from the local Multiple Listing Service with a 5-year comparison. Since real estate trends can vary by location, we grouped our study by zip code to evaluate the performance of each area.
Key Findings
- Louisville 40212 recorded the highest percentage growth in 5 years (126.86%). The only zip code on the list that doubled in price.
- Prospect, 40059 saw the greatest financial uplift in terms of the dollar amount, up $220,000 in 5 years.
- Out of the 42 zip codes analyzed in the study, 41 zip codes witnessed an increase of 20% or more over the last 5 years.
Louisville Home Prices Surged in these Zip Code
Below is a list of the top 25 zip codes that recorded the highest percentage growth in the last 5 years. Topping the list is 40212, the only zip code where the median sale price has more than doubled in the last 5 years.
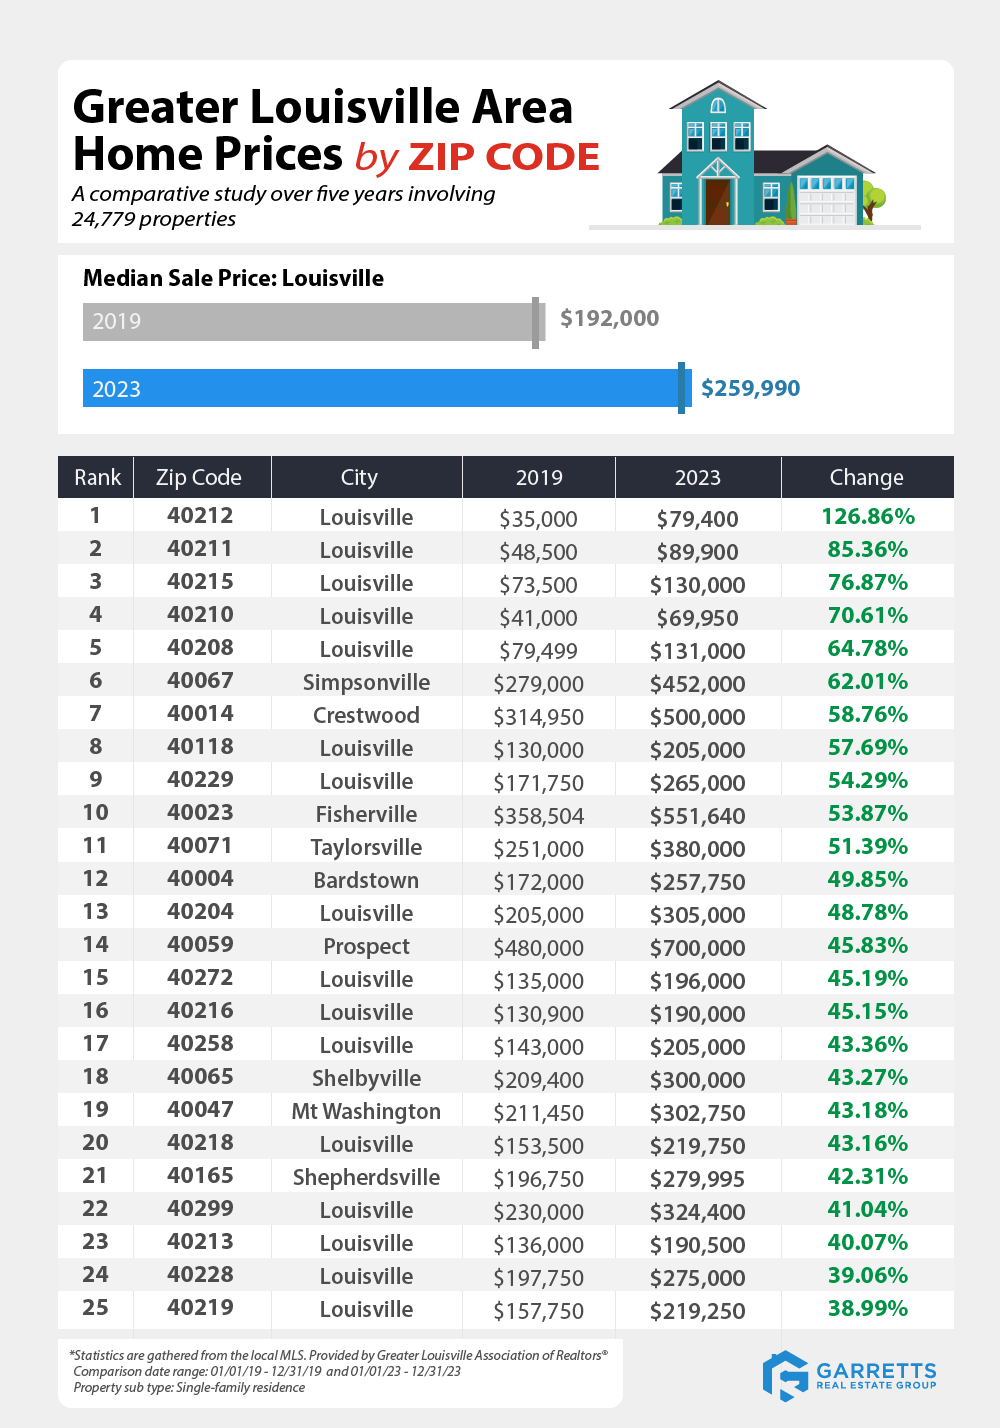
The top 5 zip codes in the Greater Louisville Area with the highest percentage growth.
- Louisville 40212 - 126.86%
- Louisville 40211 - 85.36%
- Louisville 40215 - 76.87%
- Louisville 40210 - 70.61%
- Louisville 40208 - 64.78%
One of the primary obstacles for homebuyers is affordability. Notably, some of the areas with the highest growth were zip codes where the median sale price was below the market average.
Currently, Louisville's affordability index stands at 101.36. This indicates that, on average, homes in Louisville are within range of the standard for affordability and why we have seen such a strong increase in home prices in most of the areas.
Home sales are Down around Louisville
Year over year we have seen a decline in sales here in the Greater Louisville Area. Among the 42 zip codes analyzed, only six experienced an increase in the number of units sold compared to five years ago.
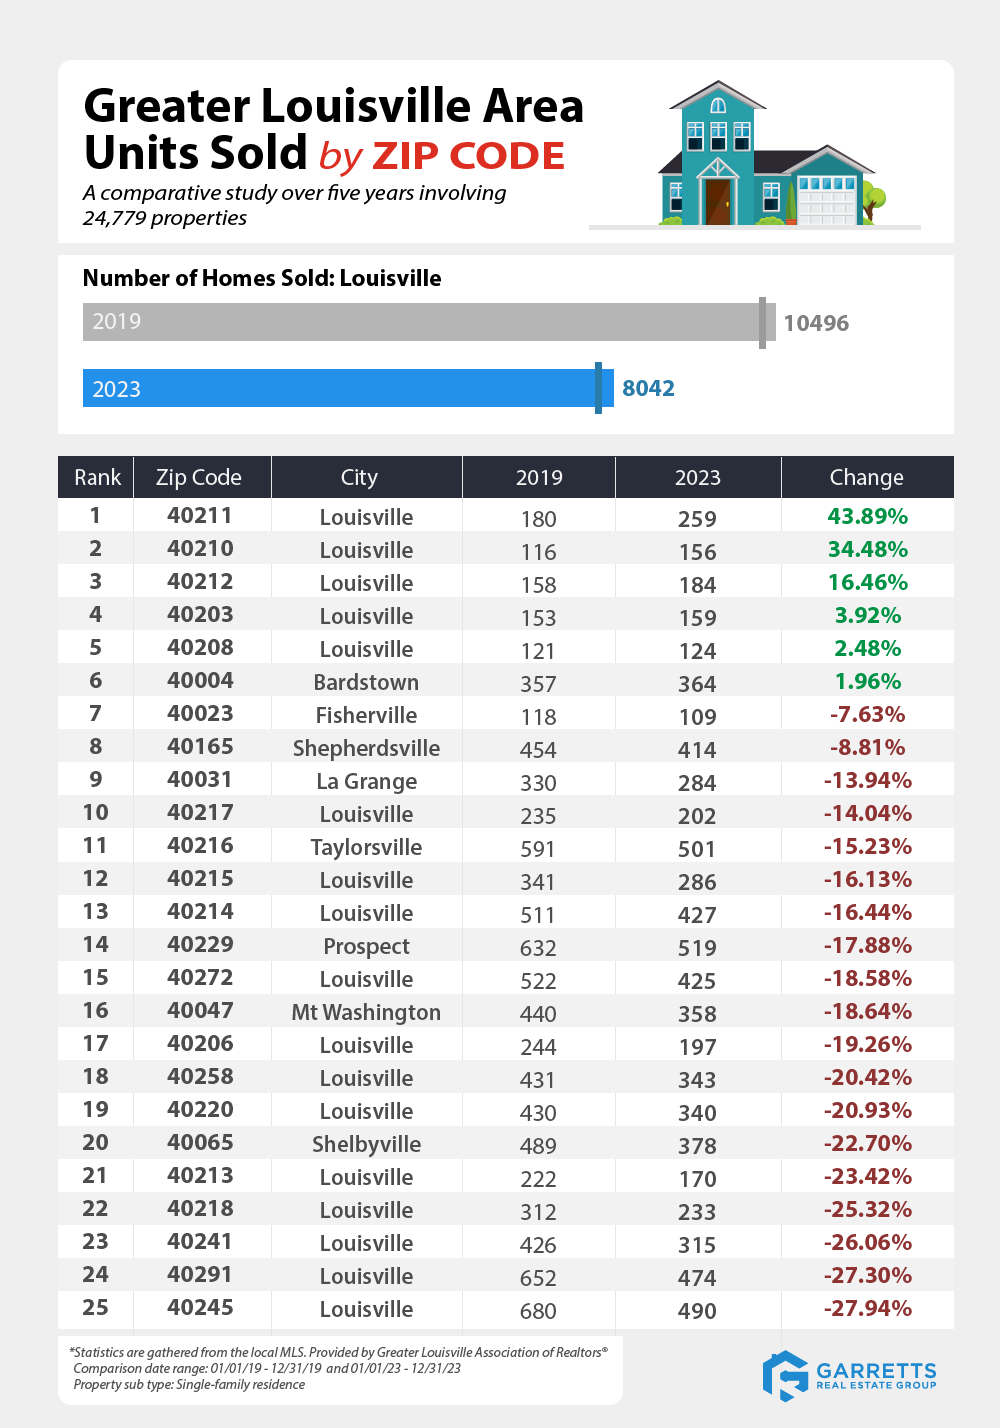
The top 5 zip codes in the Greater Louisville Area for number of homes sold.
- Louisville 40211 - 43.89%
- Louisville 40210 - 34.48%
- Louisville 40212 - 16.46%
- Louisville 40203 - 3.92%
- Louisville 40208 - 2.48%
Notably, Louisville's 40211 zip code saw the most significant rise, with sales increasing by nearly 44%. The increase was rare for the area, only three other zip codes witnessed a double-digit increase in sales.
Most housing markets across the country experienced significant slumps due to the lack of supply and the inability to meet demand. Another challenge for home buyers who have found themselves priced out of the limited number of homes on the market.
Map of Home Prices across Greater Louisville Area
In the past five years, the median sale price in Louisville increased by $67.990. Prospect 40059 experienced the most significant financial gain in terms of dollar amount. With a $220,000 rise in median sale price since 2019. One of the highest priced areas for Oldham County real estate.
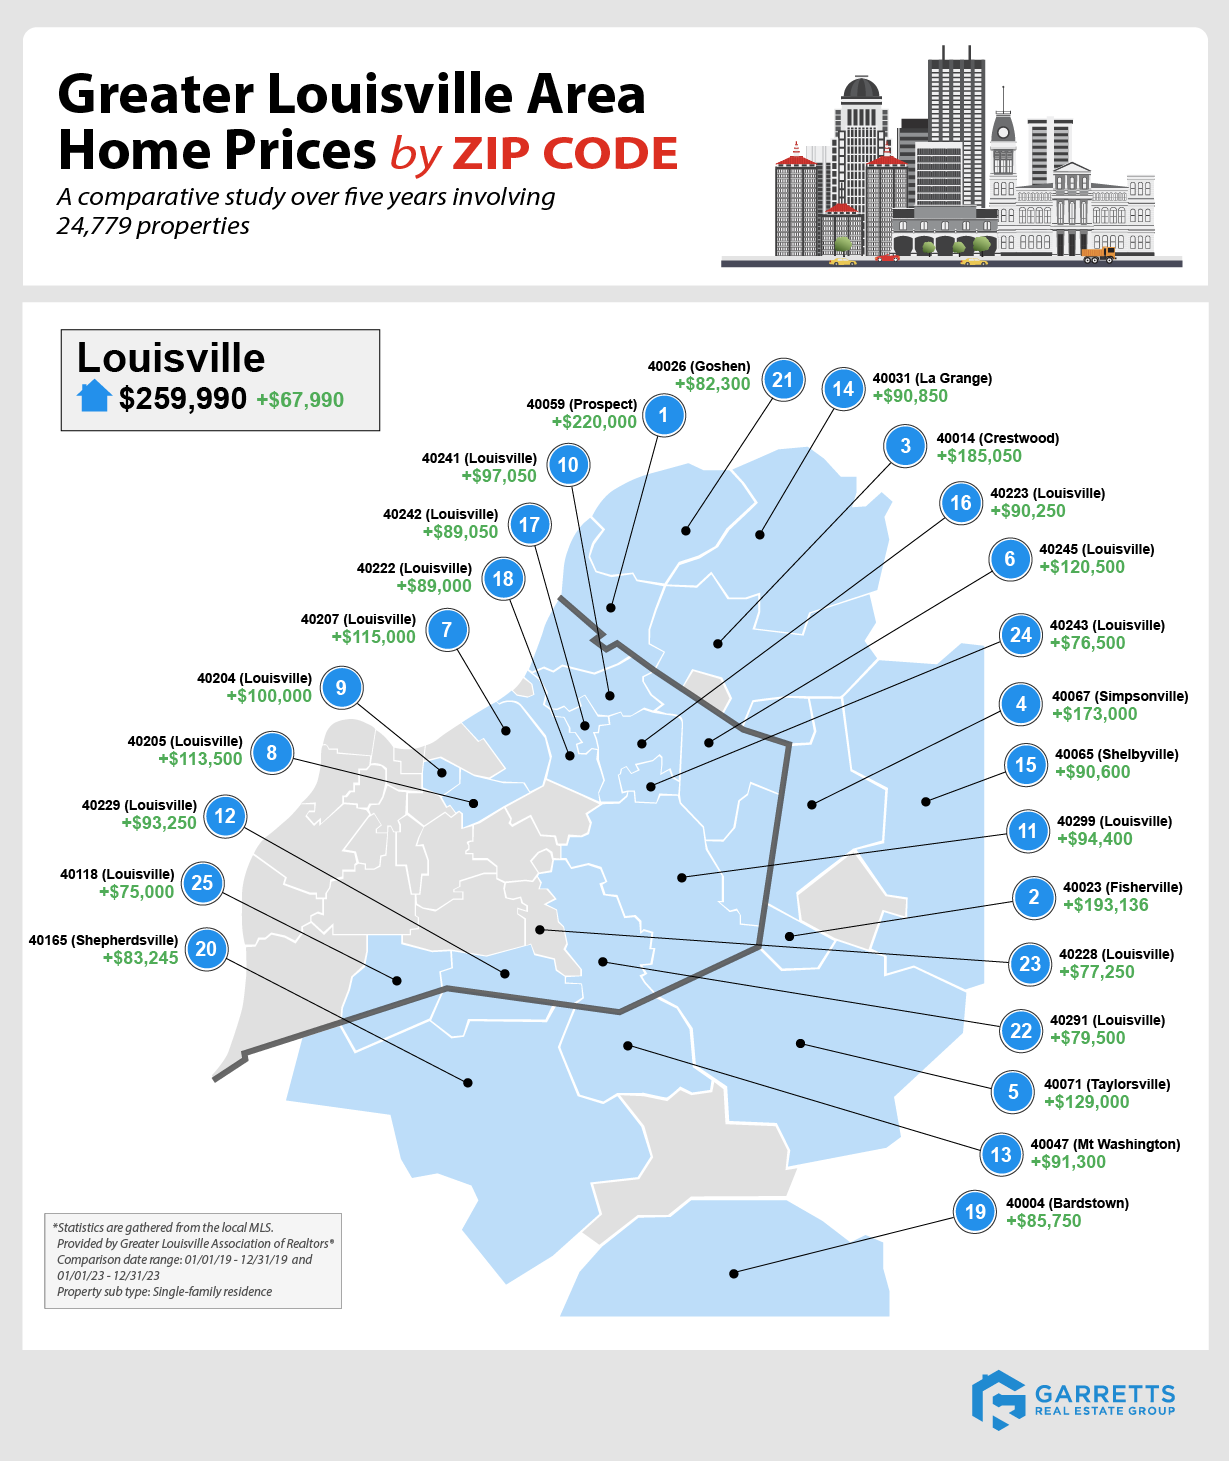
The top 5 zip codes in the Greater Louisville Area that had the greatest financial uplift in terms of the dollar.
- Prospect 40059 - $220,000
- Fisherville 40023 - $193,136
- Crestwood 40014 - $185,050
- Simpsonville 40067 - $173,000
- Taylorsville 40071 - $129,000
Median Sale Price Growth (Overall Dollar Amount)
Below is the complete list of each zip code in the Greater Louisville Area sorted by dollar amount growth within the last five years.
| Zip Code | 2019 | 2023 | DIFF |
|---|---|---|---|
| 40059 | $480,000 | $700,000 | $220,000 |
| 40023 | $358,504 | $551,640 | $193,136 |
| 40014 | $314,950 | $500,000 | $185,050 |
| 40067 | $279,000 | $452,000 | $173,000 |
| 40071 | $251,000 | $380,000 | $129,000 |
| 40245 | $349,450 | $469,950 | $120,500 |
| 40207 | $310,000 | $425,000 | $115,000 |
| 40205 | $298,000 | $411,500 | $113,500 |
| 40204 | $205,000 | $305,000 | $100,000 |
| 40241 | $301,950 | $399,000 | $97,050 |
| 40299 | $230,000 | $324,400 | $94,400 |
| 40229 | $171,750 | $265,000 | $93,250 |
| 40047 | $211,450 | $302,750 | $91,300 |
| 40031 | $270,000 | $360,850 | $90,850 |
| 40065 | $209,400 | $300,000 | $90,600 |
| 40223 | $324,750 | $415,000 | $90,250 |
| 40242 | $239,950 | $329,000 | $89,050 |
| 40222 | $279,500 | $368,500 | $89,000 |
| 40004 | $172,000 | $257,750 | $85,750 |
| 40165 | $196,750 | $279,995 | $83,245 |
| 40026 | $395,200 | $477,500 | $82,300 |
| 40291 | $212,500 | $292,000 | $79,500 |
| 40228 | $197,750 | $275,000 | $77,250 |
| 40243 | $262,500 | $339,000 | $76,500 |
| 40118 | $130,000 | $205,000 | $75,000 |
| 40206 | $263,250 | $335,000 | $71,750 |
| 40220 | $207,850 | $275,000 | $67,150 |
| 40218 | $153,500 | $219,750 | $66,250 |
| 40258 | $143,000 | $205,000 | $62,000 |
| 40217 | $183,000 | $244,600 | $61,600 |
| 40219 | $157,750 | $219,250 | $61,500 |
| 40272 | $135,000 | $196,000 | $61,000 |
| 40216 | $130,900 | $190,000 | $59,100 |
| 40215 | $73,500 | $130,000 | $56,500 |
| 40214 | $149,000 | $205,000 | $56,000 |
| 40213 | $136,000 | $190,500 | $54,500 |
| 40208 | $79,499 | $131,000 | $51,501 |
| 40212 | $35,000 | $79,400 | $44,400 |
| 40211 | $48,500 | $89,900 | $41,400 |
| 40203 | $145,000 | $185,000 | $40,000 |
| 40056 | $245,000 | $275,000 | $30,000 |
| 40210 | $41,000 | $69,950 | $28,950 |
Methodology
We analyzed 24,779 properties from the local MLS provided by the Greater Louisville Association of Realtors®. Covering five years with two comparison ranges. January 1, 2019, to December 31, 2019, and from January 1, 2023, to December 31, 2023. Our study aimed to focus on trends for home prices and sales in the area and included data for single-family residences only. Which excluded statistics from other property sup-types such as condominium and farm sales.
We encourage sharing or reposting the following article. If you choose to do so, we kindly ask that you credit us as the source by including a link to GarrettsRealty.com or this specific page. This allows your audience to explore further details about our analysis, including the research and methodology used in our study.
To learn more about the real estate market in the zip codes mentioned in this study, visit the links below: